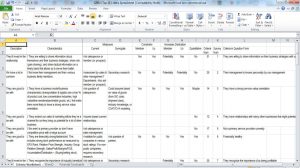
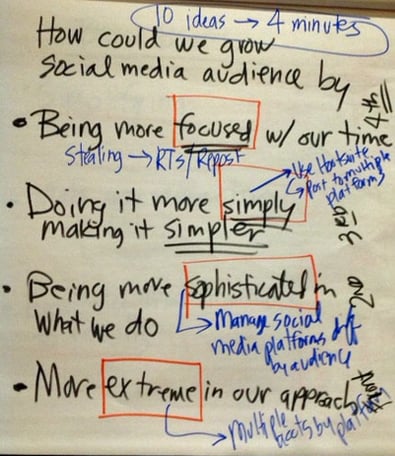
We have run several posts on visual thinking tools we find particularly valuable in the Brainzooming process. One of my personal favorite visual thinking tools is a matrix, grid, or table. Maybe I like a matrix so much because I liked an orange divided dinner plate from my childhood since it kept different types of food separated from each other. A matrix does a similarly effective job of separating data and ideas to better compare and contrast them.
For whatever reason, from the first time I used a spreadsheet, I gravitated to using matrices for both numerical and prose-based data display.
9 Reasons a Matrix Is One of the Hardest Working Visual Thinking Tools

When you use a matrix to organize data, it does many of the same things an xy graph does since each displays available information along two dimensions, with the opportunity to create smaller categories along each dimension as well.
A matrix is an especially hard working visual thinking tool since it:
- Creates structure for data while still providing flexibility. Simply changing the dimensions used to organize the information allows for a potentially very different look.
- Can convey, depending on the dimensions you choose, relationships based on chronology, proximity, organizational structure, dependencies, characteristics, etc.
- Allows text, numbers, symbols, images, and even colors to display and communicate comparative insights.
- Frees data in the matrix from having to point out relationships to the two labels describing a particular cell’s position. This allows data to address other important insights and relationships.
- Can be either tremendously information dense or highly stylized and simple based on its size and the analytical needs.
- Invites comparisons and contrasts between and among adjoining cells. Depending on the size and arrangement of the matrix, one cell can have adjacent contrasts with as many as eight cells (those on each of the four sides and four additional cells at the corners).
- Can make sameness more obvious since identical or similar data will stand out (and potentially lead you to revise the matrix dimensions to accentuate differences).
- Can make various types of differences stand out, particularly varying levels of information completeness or ratings.
- Is generally portable between spreadsheet, document, and presentation software programs.
Those are some strong visual thinking advantages that make using a matrix a compelling data display choice.
Are you a fan of using a matrix as a visual thinking tool?
Do you use matrices often? If so, what other advantages do you see a matrix providing for your visual thinking needs? – Mike Brown
If you enjoyed this article, subscribe to the free Brainzooming blog email updates.


